|
Current price |
Compared to the previous day's close |
Compared to the beginning of the year |
|
|
Commodity |
|||
|
Brent (dollar/barrel) |
78.13 |
- 0.34 |
- 5.33 |
|
WTI (dollar/barrel) |
73.44 |
- 0.42 |
- 4.96 |
|
Gold (dollar/ounce) |
1,933.90 |
1.40 |
103.80 |
|
Indices |
|||
|
Dow-Jones |
33,944.40 |
209.52 |
797.15 |
|
S&P 500 |
4,409.53 |
10.58 |
570.03 |
|
Nasdaq |
13,685.48 |
24.77 |
3,219.00 |
|
Nikkei |
32,194.49 |
- 193.93 |
6,099.99 |
|
Dax |
15,673.16 |
69.76 |
1,749.57 |
|
FTSE 100 |
7,273.79 |
16.85 |
- 177.95 |
|
CAC 40 INDEX |
7,143.69 |
31.81 |
669.93 |
|
ShanghaiComposite |
3,219.21 |
22.60 |
129.95 |
|
BIST 100 |
6,270.41 |
83.32 |
761.25 |
|
RTS |
993.19 |
17.11 |
51.84 |
|
Currency |
|||
|
USD/EUR |
1.1018 |
0.0100 |
0.0300 |
|
GBP/USD |
1.2878 |
0.0000 |
0.0800 |
|
USD/JPY |
140.7700 |
- 1.4400 |
9.6500 |
|
USD/RUB |
90.9425 |
- 0.4300 |
17.1900 |
|
USD/TRY |
26.0907 |
0.0300 |
7.4000 |
|
USD/CNY |
7.2011 |
- 0.0200 |
0.3100 |
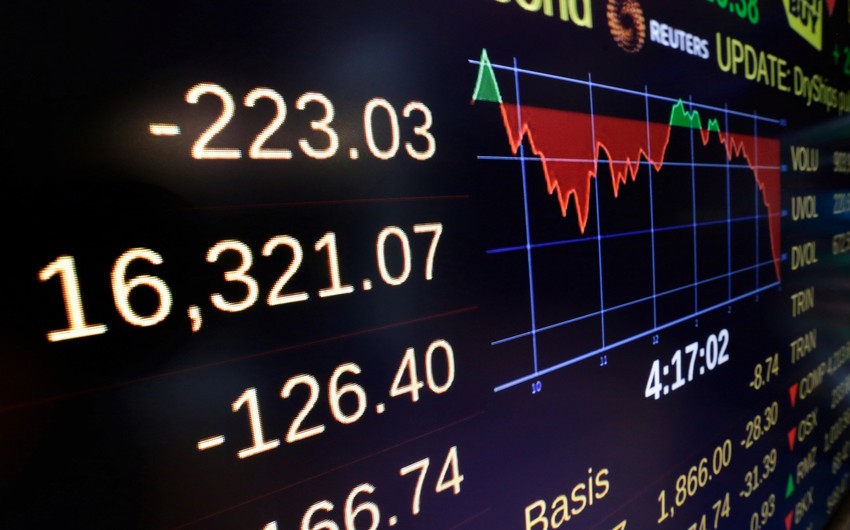
Key indicators of world commodity, stock, and currency markets (11.07.2023)
Finance
July 11, 2023
09:19
 https://static.report.az/photo/b42a5612-21eb-3a5e-95e3-36c95091c411.jpg
Azerbaijani version
Beynəlxalq əmtəə, fond və valyuta bazarlarının göstəriciləri (11.07.2023)
Latest news


